
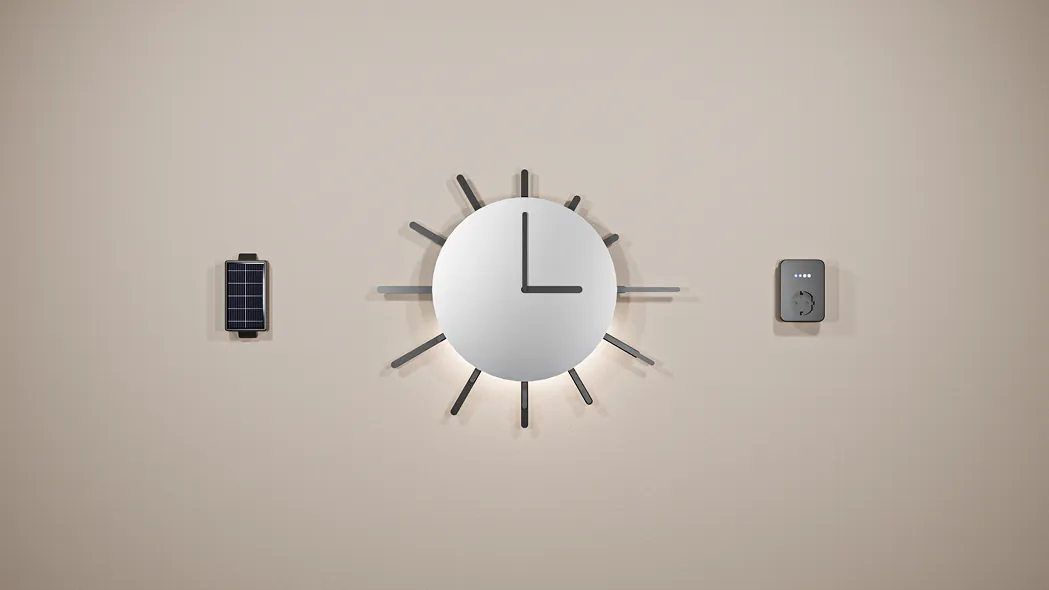
Case Study
sola. – A PV kit that makes photovoltaics understandable, from the roof to the living room
sola. is a holistic PV kit designed to lower the barrier to buying a photovoltaic system and simplify the decision process. The system consists of a Testkit that measures light and shade conditions on the roof, an app that evaluates the measurement data and simulates suitable PV systems, and a physical indicator in the form of a clock.
- My Role
- Project Management UI/UX Design (App) Testkit Development
- Team
- Leonard ZackeMagalí Wilhelm Miret (opens in a new tab)Annika Feist (opens in a new tab)Tobias Wallisch
- Context
- Invention Design 1 + Product Design 3 3rd semester, HfG Schwäbisch Gmünd Supervised by Prof. Michael Schuster
Problem Statement
People want to act, but the energy transition feels abstract and overwhelming.
The path to a home solar system usually fails for lack of orientation, rarely for lack of interest. Of homeowners without a system, just under a third concretely plan one for the next twelve months.[5] Before the purchase, it stays unclear whether and when a system pays off, and after installation, yield disappears into abstract values that usually only one person watches.
64 %
of homeowners feel poorly informed about subsidies and cost-effectiveness.[1]
28 %
less PV capacity added on homes in 2025.[2]
79 %
of respondents want to read their electricity usage as easily as the data usage on their phone.[3]
71 %
of surveyed households leave checking the yield to one person at most.[4]
Guiding question
“How can we show people without technical knowledge whether and when a photovoltaic system is worth it for them?”
Concept
sola. starts at the two points where most people get stuck: research before the purchase and use after it. From abstract energy data, sola. builds an understandable basis for the whole household to orient by, not just one person. The concept turns invisible energy flows into a physical, playful object people can touch and understand.
In detail
01Research
User & context
Our persona, Silvia, is a teacher who is frustrated by the unused solar panels on her roof, but she doesn't have time to research them. A colleague who owns a PV system overwhelms her with technical terms. Later, after the system has been installed, only her partner checks the yield, and the household often misses the moment when the battery is full.
Research across the entire lifecycle of a system revealed this same pattern at every stage, from initial offers and roof simulations to yield and consumption: something always remains unclear.
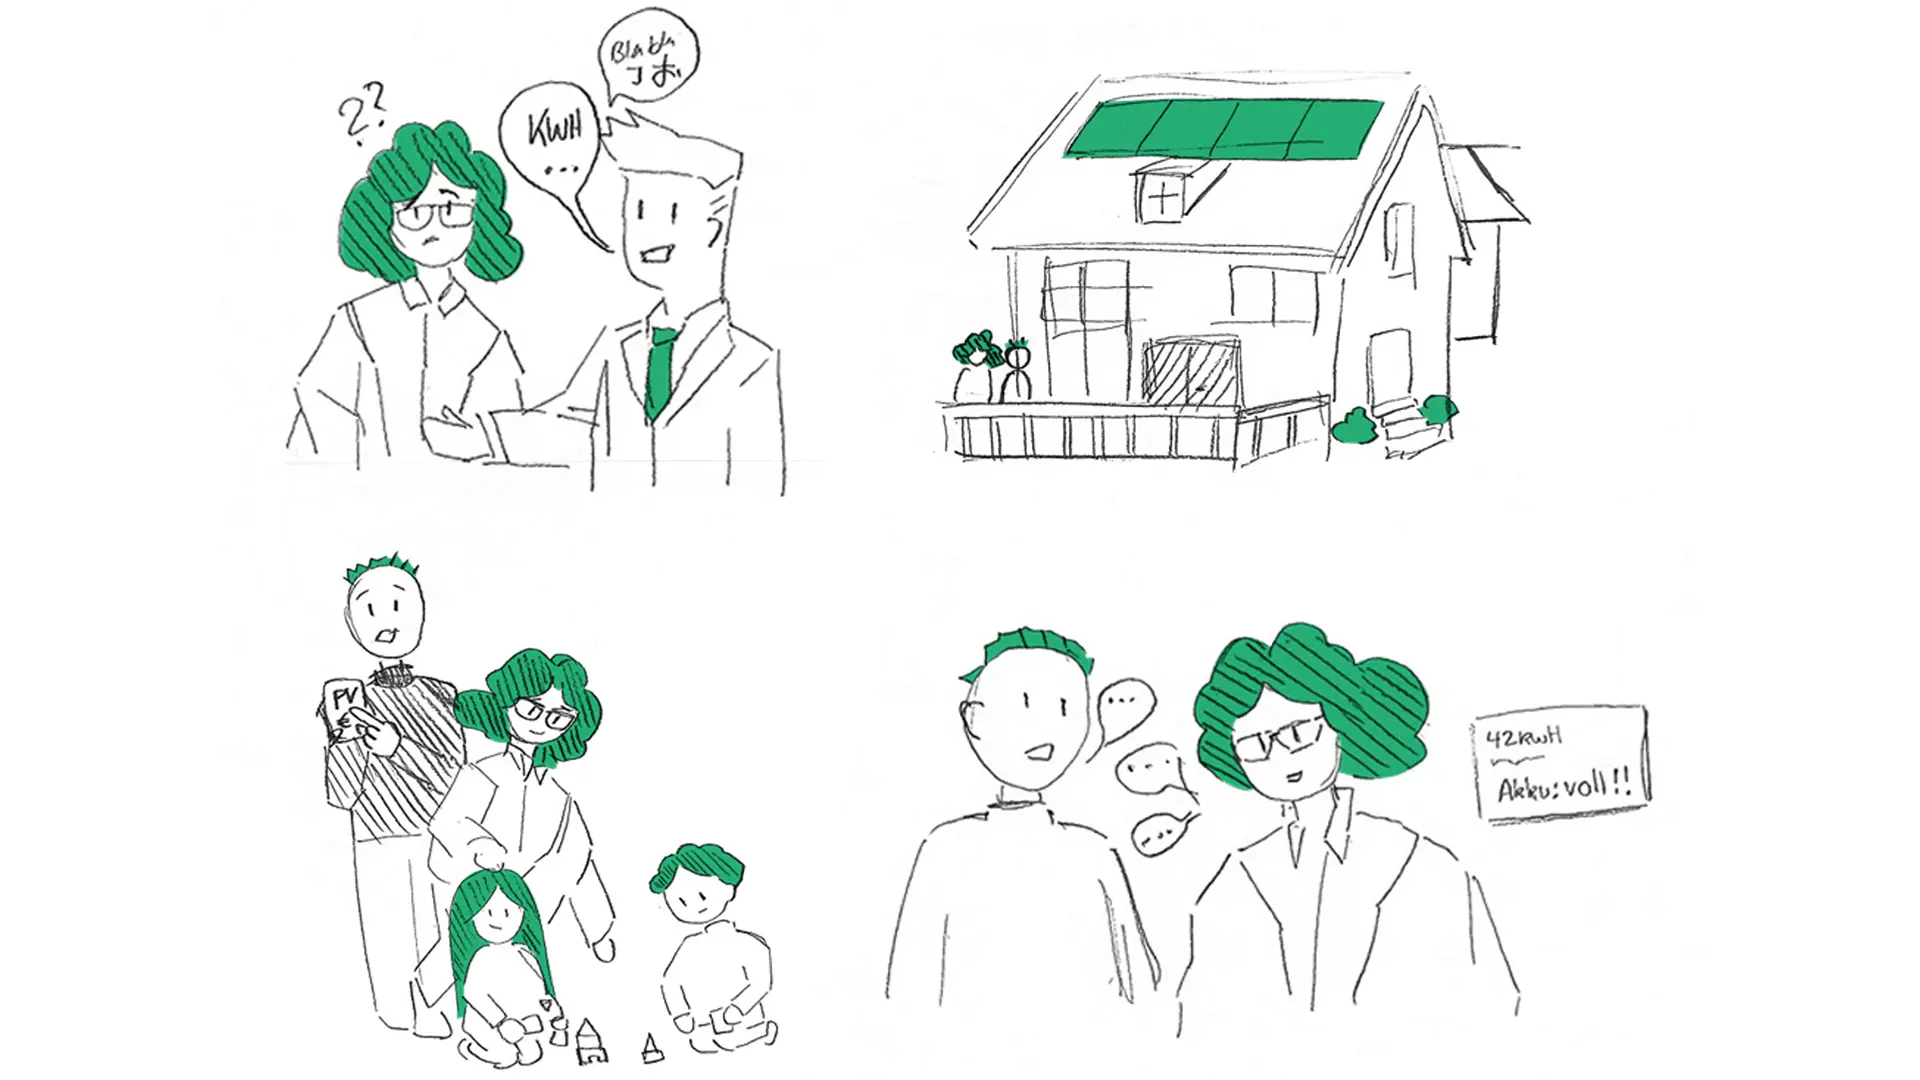
Persona Silvia and a storyboard of her everyday life with the PV system What the research says
Our own survey found that more than half of respondents rarely or never use their PV app. Instead, they rely on the inverter display, a spreadsheet or a glance out of the window, and oversight becomes the responsibility of one person. On top of that, few people can do anything with abstract kilowatt-hours.
From this, we derived two decisions: to translate energy data into everyday values, such as "loads of laundry", and to display the key values on an object that people look at several times a day anyway: an analogue living-room clock.
02Decisions
Testing it ourselves
The process began with a small solar panel from the prototyping lab, placed outside. When a cloud passed, the yield dropped sharply. This made it clear that we had to bring this kind of trial to people's own roofs.
Paths we discarded
Annika and I were responsible for the Testkit. Shade is the biggest yield killer, and generic simulations miss the tree in the garden. Each attempt to measure it failed in a different way. A 180-degree camera had a limited view and would have had to stick out unstably for full coverage. It could also look into the neighbours' property. A drone delivered precise shade data, but no real irradiance reading. A weather balloon was unstable in the wind and got tangled in branches. A virtual grid of stickers or light sensors, filmed from one panel, kept the same camera problems. Its grid idea, however, led to the final principle: the Testkit mesh – many small Testkits spread directly across the roof. When one Testkit sits in the sun while another is shaded, comparing their values shows the shade across the whole roof.
Each Testkit works on its own, with a solar panel, a microcontroller, a charge controller and a rechargeable battery. In the prototype, the Testkits send their data via Wi-Fi to a laptop acting as a hub. For the final concept, we switched to Zigbee, with a compact plug-in hub that leaves the socket free. Vacuum suction cups, activated by side levers, hold each Testkit securely on the roof.
Process of the measuring concepts: from the first ideas to the Testkit mesh across the roof. Close-up of the open Testkit: microcontroller, charge controller and battery in the 3D-printed case, with two suction cups on the base plate. Exploded view of the first clock mechanism with 24 servos, rack-and-pinion gears and toothed racks. Exploded view of the final clock mechanism with a 3D-printed structure, stepper motors and a 360-degree servo. Clock and app
A first mechanism with 24 servos, two per hour, could only rotate 180 degrees, so the rays moved too little. The final version sets the hours one after another: a servo turns the mechanism to the next hour, and two stepper motors push the rays into position via magnets.
Starting with Crazy 8s and a Design Studio Method, we turned the most promising ideas into wireframes and refined them in usability tests. Across several test rounds, we mainly checked hierarchy, visual flow and whether the payback period was understood. Each round moved further away from PV jargon: kilowatt-hours became euros saved per day, and the roof data became a shade time-lapse, a planner for placing modules and a clear payback period.
03Solution
How it works
The Testkit mesh measures light, shade and yield on the user's own roof. The app turns this into a decision that holds up without expert knowledge: savings in euros instead of kilowatt-hours, the shade progression over the day and the payback period. After the purchase, the clock brings yield, consumption and storage level into the living space, visible to the whole household without a smartphone.
Loading 3D model …
The clock: calm, not alarming
The clock follows the principle of calm technology. Instead of alert colours, brushed aluminium and matte rays make yield, consumption and storage distinguishable at a glance, without requiring number literacy.
The app: real data for the consultation
The app shows savings, shade progression and payback period based on readings from the user's own roof. Users go into a consultation with real data instead of opaque offers.
 0:00 / 0:00
04Result
Result & learnings
The result is a working prototype of the Testkit mesh, the app concept and the mechanical clock. Our survey shows willingness to pay a small amount for a Testkit before investing in an entire system.
In hindsight, we would test the clock's mechanics earlier, since we underestimated its complexity. Next steps would be long-term app usage, improvement of the Testkits and a more robust mechanism.
Diagram of the sola cycle: before purchase, the Testkit mesh on the roof sends its data to the phone app, which shows savings and yield; after purchase, the clock shows the household its yield. Rendering of a tiled roof with several Testkits spread across it. Rendering of a Testkit on a roof. The sola clock on the wall: brushed aluminium disc with black rays and a backlight that shows the PV system's storage level. Rendering of the sola clock on a living-room wall above a sideboard. Testkit, clock, hub (adapter) and app.
Sources
- [1] Civey (2024). Online survey commissioned by Qcells, Oct 30 – Nov 19, 2024. Representative through quota sampling and weighting.
- [2] German Solar Association (BSW-Solar) (2025). Analysis of the Marktstammdatenregister (German market master data register). Press release, Dec 8, 2025.
- [3] Bitkom Research, commissioned by Bitkom (2024). Representative telephone survey, calendar weeks 5–8 2024, n = 1,005 people aged 18 and over.
- [4] Own survey conducted as part of the sola project, HfG Schwäbisch Gmünd (2026).
- [5] Solarwatt market study (2023), conducted by Appinio, n = 1,000 homeowners.